Tracking and understanding data quality, analysis and reproducibility are critical concerns in the biological sciences. This is especially true in genomics where Next Generation Sequencing (NGS) based technologies such as ChIP-seq, RNA-seq and ATAC-seq are generating a flood of genome-scale data. These data-types are extremely high level and complex with single experiments capable of mapping 10-100’s of thousands of biologically meaningful events across the genome. However, such data are usually processed with automated pipelines resulting in tabular outputs, which are difficult to verify and interpret without looking at the underlying data and combining it with data from other experiments. Conventional genome browsers are limited to single locations and do not allow for interactions with the dataset as a whole. MLV has been developed to allow users to fluidly interact with genomics datasets at multiple scales, from complete metadata labelled and clustered populations to detailed representations of individual elements. It has inbuilt tools to integrate signals across multiple dataset and to perform dimensionality reduction and clustering analysis.

VIDEOS


Watch a video demonstrating the basic functionality of MLV

Uploading Data and Basic Analysis
Creating Images and Tagging Data
Clustering Data and Further Analysis

Featured Projects

The structural basis for cohesin-CTF-anchored loops
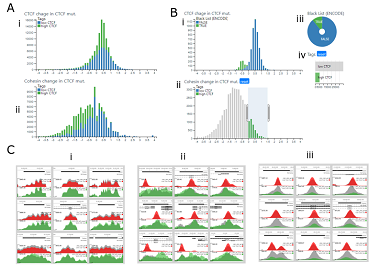
This project takes data from Li et al and looks at CTCF and cohesin ChIP-seq experiments. As well as confirming the findings of the paper, it also offers new insights into the data. There are two tutorial videos showing how the project was created, Uploading Data and Basic Analysis and Creating Images and Tagging Data
Looking at ChIP-seq signals in enhancers and prometers
This project takes ChIP-seq data from Kowalczyk et al and clusters the data based on various CHiP-seq signals using the dimension reduction algorithms tSNE and UMAP. Along with distance from TSSs, this allows the exploration of promoters and enhancers. It forms the basis of the third tutorial Clustering Data and Further Analysis

Publications

Applications that use MLV


MLV is designed to be modular and allows development of other NGS visualisation solutions

CaptureSee

CaptureSee facilitates the easy interaction with highly multiplexed 3C data. It enables users to quickly jump between capture viewpoints in the genome, to see reporter counts for each viewpoint on a per sample basis and filter DESeq2 results to find significantly interacting RE fragments.

Lanceotron

A graphical tool for peak calling chromatin profiling assays e.g. ChIPseq. Lanceotron utilises a powerful computer vision, deep learning algorithm to analyse the shape of peaks. Initial parameters can be selected interactivly and the final results further refined by the help of charts and images.

16875

USERS

99999999

PROJECTS

54875

JOBS